Story Machine provides a number of tools to help debug problems with your game: playback pause, the debug log, and debug break actions.
Playback Pause
At any time you can pause the game running in the editor with the Run > Pause menu. The game will pause and allow you to inspect (and modify!) the scene. You can review variables, lists, channels, the object hierarchy and layer order, as well as any field in any object component. You can even open action sequences and modify them as the game runs.
Once paused, the Run > Advance command will run one frame and then pause again. This is useful for slowly stepping through logic to figure out what is happening in your scene.
Debug Log
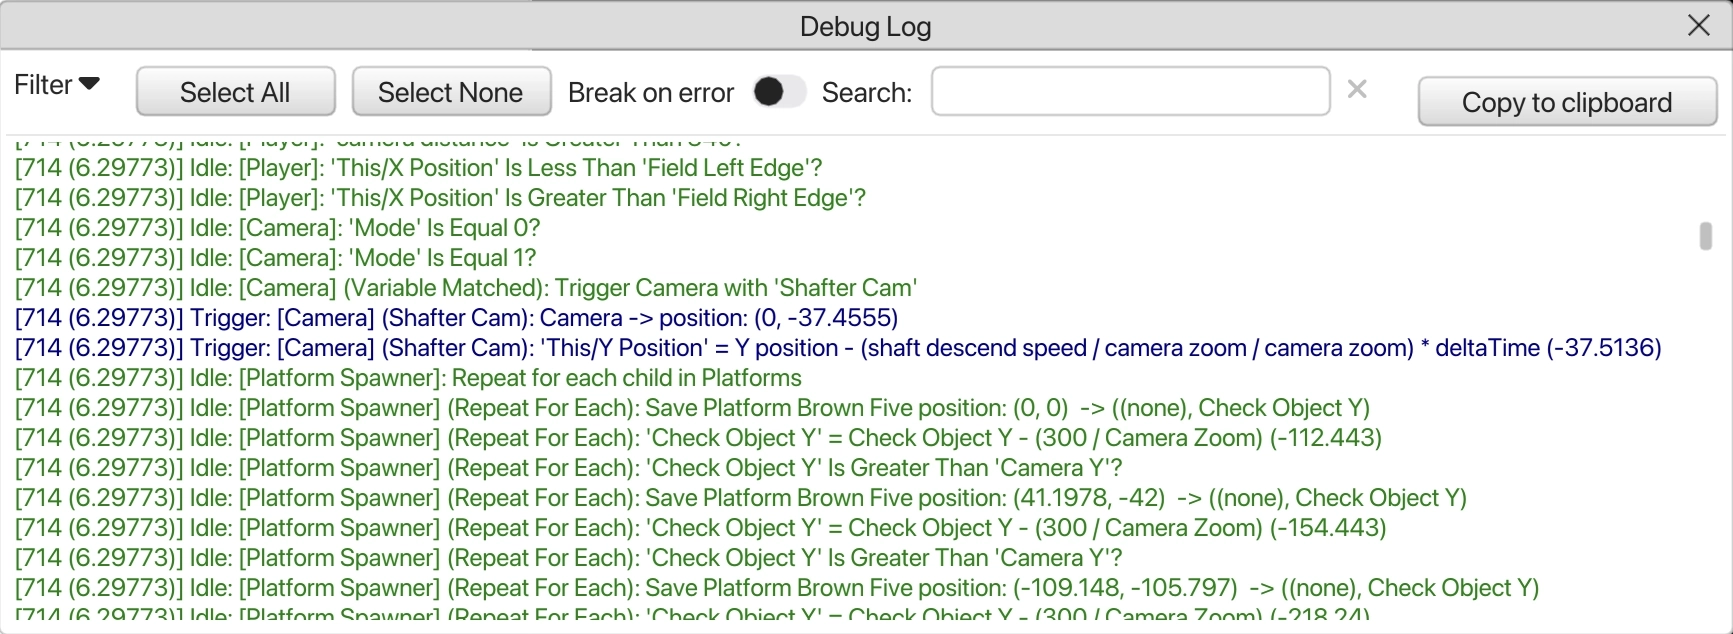
The Debug Log contains a history of every action that has been executed since playback started. It can be displayed via the Window > Debug Log menu. Log items look like this:
Debug Log sample
[98 (0.837529)] Idle: [Player]: If Floor Detector overlaps with any object with the tag ‘Floor’…
[98 (0.837529)] Idle: [Player] (Objects Overlapped): ‘state’ Is Equal 2?
[98 (0.837529)] Idle: [Player] (Variable Not Matched): Trigger Floor with ‘Get Velocity X’
[98 (0.837529)] Idle: ** Action ‘Get Velocity X’ triggered on Floor from Player not found, skipped!
[99 (0.845816)] Trigger: [Player] (Variable Matched): Trigger Powerups with ‘Add Powerup’
[99 (0.845816] Trigger: [Powerups] (Add Powerup): Save Powerup First Slot position: (-289, 255) -> (slot x, slot y)
The format of each item follows a common pattern:
[<frame numer> (seconds since game start)] <Event Type>: [Object Name] (Trigger Name): <message>
The example above shows logs from two frames, frame 98 and frame 99, which happend 0.837 seconds and 0.845 seconds from the start of the game, respectively. On Frame 98 and Idle Event Receiver on the Player object checked to see if an object called Floor Detector overlapped with any floors, and after checking some state tried to call a trigger called “Get Velocity X”. On Frame 99, a trigger that was also running on the Player object checked a variable and then called the “Add Powerup” trigger on the Powerups object, which stored the position of another object in some variables (“slot x” and “slot y).
The Debug Log can be very noisy, especially in games that use Idle event receivers. It’s not uncommon to have thousands of logged messages every second. Therefore, it’s useful to filter the log using the Filter menu (which selects certain types of events to display) and the Search box (which only displays log entries that contain the search text) to narrow down the reports that you are looking for. The entire log can also be copied to the clipboard and pasted into some other program for review.
When an error occurs, it will appear in the log as an Error message type, colored red. In the example above, the attempt to call “Get Velocity X” on the floor failed, as no trigger by that name exits on the floor, and the error was logged. By checking the Break on error check box, you can force the game to pause as soon as an error occurs.
Debug Break
The Debug Break action acts like a breakpoint in an action sequence: it immediately pauses the game and does not allow further actions to continue until playback is explicitly resumed. Debug Breaks are a great way to stop execution of a complex action sequence and check the state of variables, or objects, or review the sequence of events up until the break in the log. Debug Breaks do nothing in exported games.